Aotearoa Birdsong, Decoded
We downloaded 3,096 recordings of New Zealand birds from Xeno-Canto, then classified vocalisations for three species using published literature frameworks: tūī syllables (Hill & Ji 2014), korimako (bellbird) syllables (Webb 2021), and kākā calls (Van Horik 2007). Here's what automated analysis finds — and where it diverges from manual fieldwork.
(XC + Koe)
detected
detected
Checked 5 August 2026: an internal audit flagged 3,156 as a possible copy-paste error, because the same figure appears on this page both as a recording count and as the bellbird click syllable count. It is a coincidence — both are correct. Recordings = 3,096 Xeno-Canto (Methods, below) + 60 Koe = 3,156. Clicks = 3,156 of 13,086 bellbird syllables = 24.1%, consistent with every other row of that table. We record the check here rather than silently leaving it, so the next reader does not have to repeat it. Note that 3,096 is the raw query result; after filtering, the clean identified dataset is 2,244 recordings across 175 species.
Why separate species? Tūī and korimako are both oscine passerines (songbirds) that produce complex learned songs — but their vocal repertoires are categorised differently in the literature. Tūī research uses 6 syllable categories based on spectral features. Korimako researchers found that syllable types (not song types) are the functional units of vocal culture, because korimako flexibly recombine syllables. Kākā are parrots, not songbirds — they produce calls, not songs, and the term "syllable" is inappropriate for their vocalisations.
v2 classifier improvements: The v1 analysis over-assigned "low-frequency" syllables (55%) due to a threshold-ordering artefact — syllables with low f₀ but strong upper harmonics were caught by the frequency check before reaching the harmonicity check. The restructured classifier checks tonal quality first, then frequency, reducing low-frequency to 0.6% of tūī syllables (unchanged from the first v2 pass, now confirmed on a doubled sample) — consistent with Hill's finding that these are relatively rare.
Tūī — 6 Syllable Categories
RMNR dominates at 64.7% — rapid multiple note repetition is the most common syllable type. Trill accounts for 17.5%, harmonic 13.8%, high-frequency 3.3%, and low-frequency just 0.6%. No harsh syllables were detected, which may reflect recorder bias (harsh syllables are quiet and close-range).
Korimako — 7 Syllable Families
Stutter syllables still dominate, at 56.1% — down from 62.8% in the smaller v1 sample, a real ~7-point shift as the sample doubled, not noise. Click has correspondingly grown to 24.1% (was 19.4%), trill 12.6%, complex 3.8%, warble 3.3%, and pipe 0.1% follow. The 15ms syllable boundary (Roper 2018) captures finer segmentation than the 20ms tūī threshold.
Kākā — 5 Call Types
Snicker calls dominate at 85.5% — rapid chattering series are by far the most common call type. Bark (12.6%) and gurgle (1.8%) follow. Shraak and shraak-woo (loud long-distance contact calls) were not detected — likely because field recordings capture closer-range vocalisations.
Why Species Must Not Be Lumped
Tūī and korimako are both honeyeaters (Meliphagidae) and songbirds, so comparing syllable entropy between them is defensible — with caveats about different classification granularity. But kākā are parrots (Psittaciformes) with fundamentally different vocal learning mechanisms, repertoire size (5 call types vs hundreds of syllable types), and vocal structure. Cross-species comparison between songbirds and parrots is, as Socrates would say, not carving nature at its joints.
Interactive Tools — Try It Yourself
Beyond the literature-derived categories here, we built two companion tools on the hand-labelled Koe bellbird data. The PCA clustering tool plots 818 syllables spike-sorting style across linked principal-component panels — lasso, inspect spectrograms, play audio, and assign categories. The annotation tool lets collaborators match candidate syllables to reference templates, with password-based sync so multiple people can contribute without a GitHub account. This data-driven work seeded the DTW template-matched categories shown in the Vocalisation Analysis tab.
Te Reo Manu
Aotearoa's birds each sing their own language. The tūī is the most complex vocalist — 36,268 syllables across five types, combined in patterns that are 44.2% predictable (v2 classifier; not directly comparable to prior estimates — see Methodology).
Can you learn to read the language of birds?
Fourteen native and endemic species with the most Xeno-Canto recordings. Photos from Wikimedia Commons (CC/public domain).
Every number on this page comes out of one sequential pipeline. Raw field audio goes in; named individuals come out. Each stage is validated on held-out birds before the next stage consumes its output, so errors do not silently propagate. This is the songbird pipeline (korimako, tūī); call-producing species like kākā follow a related but distinct path (placeholder below — sequence grammar carries individual identity in songbirds but not in calls).
▸ Proposed call-species pipeline (kākā) — placeholder, pending more Shaw-lab data
Vocal learning — the ability to acquire vocalisations through imitation rather than instinct — is rare among animals. In the entire animal kingdom, only three groups of birds (songbirds, parrots, and hummingbirds) share this capacity with humans (Hyland Bruno et al. 2021). This convergent evolution makes birdsong one of the most powerful natural models for understanding how brains learn, produce, and culturally transmit complex vocal behaviour — including human speech (Aamodt, Farias-Virgens & White 2019).
Detailed vocalisation analysis is how researchers decode this system. By classifying vocal units and measuring their diversity, sequencing, and geographic variation, we can ask: How complex is a species' repertoire? Does it vary between populations? What does vocal complexity signal about ecology and social structure?
Songs vs Calls
The traditional distinction (Catchpole & Slater 2008): songs are longer, more complex, often learned vocalisations typically associated with territory defence and mate attraction; calls are shorter, simpler, and often innate — used for alarm, contact, and flock coordination. In practice the boundary blurs, especially in Southern Hemisphere species, but the distinction matters for analysis: tūī and korimako produce songs built from syllables, while kākā produce calls of distinct types.
Song Structure: Syllables, Motifs, and Call Types
Birdsong is hierarchically structured (Berwick et al. 2011). A syllable is the smallest discrete vocal unit — a continuous sound bounded by silence. Syllables combine into motifs (repeated stereotyped sequences), and motifs into songs. Different species organise these units differently: tūī songs contain hundreds of syllable types in flexible sequences, while korimako researchers found that syllable types (not song types) are the functional units of vocal culture, because korimako flexibly recombine syllables across songs. Parrots like kākā don't produce songs at all — they use distinct call types, each serving a different social function.
Each point is one syllable, embedded in 3D by acoustic similarity (UMAP over the spectral descriptors from our pipeline). Islands of points are the bird's syllabic textures — an acoustic signature you can orbit. Click any point to hear that syllable, or play the whole song through the manifold with highlights synced to the real syllable onsets. Default view is a korimako song segmented and typed by the current pipeline (TweetyNet v2 + stage-4 family classifier); earlier tūī examples from the legacy rule-based pipeline are in the dropdown. Drag to orbit, scroll to zoom.
1,607 geotagged recordings from Xeno-Canto, coloured by species. Click markers for recording details. Use the filters to isolate species of interest.
Syllable type proportions across regions, using v2 species-specific classifiers. Tūī sorted by vocal diversity (Shannon entropy).
Tūī Syllable Mix by Region
Regional Diversity Index
Shannon entropy of syllable types per region — higher = more diverse repertoire.
Trill Gradient
Tūī trill usage varies regionally — Northland and Marlborough tūī show the most trill activity, while Waikato and Tasman/Nelson birds trill less frequently.
Kākā Vocal Profiles by Location
Southland / Stewart Island
8 recordings, 404 calls. The most diverse kākā vocal profile: 60.1% snicker, 32.7% bark, and 7.2% gurgle — this is the only population with substantial gurgle calls. Bark calls are 5× more common here than in Waikato.
Waikato / Pureora Forest
12 recordings, 476 calls. Overwhelmingly snicker-dominant at 93.1% — bark only 6.1%, gurgle 0.8%. These are mainland forest birds with a notably uniform vocal profile compared to the island population.
Korimako Syllable Mix by Region
Recording Quality
Recording Type
Top 20 Species by Recording Count
Full Species Inventory
| # | Species | Recs | Q:A | Q:B | Songs | Calls | Top Regions |
|---|
How We Did This
Data Collection
We queried the Xeno-Canto API v3 for all recordings geotagged to New Zealand, yielding 3,096 recordings across 177 species (including soundscapes and unidentified). After filtering, the clean dataset contains 2,244 identified bird recordings across 175 species.
- Quality ratings: A (930), B (1,669), C (324), D (123), E (9)
- Recording types: 1,049 songs, 1,178 calls, 869 other
- Date range spans several decades of field recording
Syllable Analysis Pipeline
Replicating Hill & Ji (2014) as closely as possible given the different recording conditions:
- Audio preprocessing: Resampled to 44.1kHz mono (matching Hill's Marantz PMD620 recorder)
- Spectrogram: DFT window = 256 samples, Hann window, 50% overlap (matching Hill's Raven Pro 1.4 settings: 2.9ms window)
- Song detection: Band-limited energy thresholding in the 0.5–10kHz range, with median filtering to remove transients
- Syllable parcellation: ≥20ms pause criterion with dynamic energy threshold (Hill's method)
- Feature extraction: Fundamental frequency via YIN algorithm, 13 MFCCs, spectral centroid/bandwidth/rolloff/flatness, zero-crossing rate, FM rate
- Classification: Rule-based following Hill's 6 categories:
- Low-frequency: dominant frequency <2kHz
- High-frequency: dominant frequency ≥5kHz
- Harmonic: clear harmonic structure (low spectral flatness)
- Trill: rapid amplitude modulation (>10 Hz)
- RMNR: rapid modulated narrowband repeats
Known Limitations
- Recording quality varies: XC recordings range from professional to phone-quality; Hill used a consistent Marantz PMD620 + Sennheiser ME67 setup
- No "harsh" or "other" categories: Hill's manual classification included these; our rule-based system forces syllables into the five automated types
- Threshold sensitivity: The 2kHz low-frequency cutoff may capture environmental noise and non-vocal sounds
- Single-site vs multi-site: Hill's results come from one population (Tawharanui); ours span the country, so inter-population variation is confounded with methodological differences
Deep Learning: CNN Segmentation
Everything below this box is the record of how we got here, kept unedited per the kaupapa of this project. But it is now history, not the live pipeline. If you read one section on this page, read this one — it names what actually generated tonight's korimako figures and manifold.
The current korimako pipeline, end to end:
- Segmentation: TweetyNet v2 (CNN), F1 = 0.902 on a held-out test split — this supersedes the 0.8577 result below, which was measured on a split with bird-level leakage between train/val/test (see the 5 August correction). The new number is not directly comparable to the old one; treat 0.902 as the current best estimate, not confirmation the old number was "wrong by exactly this much."
- Syllable typing: a stage-4 family classifier trained on the Koe hand-labelled corpus (Fukuzawa et al. 2020), 0.893 test accuracy across 24 families plus UNKNOWN — this replaces the rule-based 5-category Hill & Ji scheme for korimako specifically (that scheme was built for tūī and is retained for tūī, see below).
- Sex from repertoire: 5-fold cross-validated, 0.940 CV accuracy on 454 birds (≥10-syllable subset), 0.892 on the 107 birds held out of all training.
- Site / dialect from repertoire: repertoire composition identifies home site.
- Individual identification: closed-set, 77 birds, top-1 55% / top-5 80%; reliable per-bird estimates need ≈6–8 songs, and the corpus is thin there (median 2 songs/bird) — stated plainly on the korimako panel rather than hidden.
The tūī analysis below (rule-based Hill & Ji categories, CNN segmentation only, no typing model) is not superseded — it is a separate species with its own pipeline, which is why the acoustic manifold now shows a korimako example (TN v2 + stage-4) front and centre and keeps the tūī recordings as a labelled "legacy rule-based" option in the dropdown, not because the tūī work is wrong, but because it is a different, older method applied to a different bird. Kākā uses a third, call-based framework (Van Horik 2007 / Vaishnav 2026) that has no sequence grammar and is out of scope for the sequence-based methods below.
Full-corpus figures (repertoire, sex, site, atypical individuals) recompute on 1,065 birds / 21,463 syllables for the main tier, and separately on the 107-bird test split never seen in training, for the honest-tier check. Both are on the live korimako panel with per-figure n stated.
Model Extrapolation — running trained models on unannotated field recordings
Every number above comes from the Koe corpus — recordings collected under a consistent protocol and hand-annotated by the original researchers. That is not the same question as does this pipeline work on an arbitrary field recording with no ground truth, which is the situation anyone actually deploying this would face. We ran TN v2 + the stage-4 classifier, cold, on Macaulay Library korimako recordings never touched by training or evaluation, to find out.
It runs, and produces plausible output. On a clean 25s field recording (Nelson Lakes NP, Feb 2023), the pipeline found 48 syllables across 13 stage-4 families with sensible temporal boundaries and no degeneration to noise or a single repeated label. There is no ground truth for this recording, so this cannot be scored as accurate — it demonstrates the pipeline runs end-to-end on real audio, not that its output is correct. That distinction matters and we are not blurring it.
Detection confidence measurably degrades with recording quality — but only visible at scale, not from single examples. We scored 836 Macaulay bellbird recordings by an SNR proxy (20th-vs-95th percentile energy ratio in the vocal band; the same idea as Xeno-Canto's A–E quality field, computed directly since Macaulay has no such rating), then ran the segmentation model's raw frame-level detection probability on the 607 usable recordings (excluding near-silent and near-continuous-noise clips). Result: mean confident-frame fraction (p≥0.6, the validation-tuned threshold) rises 0.089 → 0.151 → 0.188 from the low to medium to high SNR tertile (Spearman r=0.508, p<0.0001, n=607). Lower-quality recordings genuinely produce less confident segmentation.
A single-example comparison across quality tiers was actively misleading, and we are keeping the record of that rather than quietly fixing it. Our first attempt picked one representative recording per SNR tertile and found the opposite pattern — the low-SNR example produced 8× more segments than the high-SNR one, which we initially (wrongly) read as the model hallucinating on noise. Checking the actual frame-level detection probabilities showed that recording was simply more vocally active, and a separate medium-quality example had a genuine, undetected 7-second song passage that the single-example view made easy to miss entirely. The population-level result above (n=607) is what actually holds; the anecdote did not generalise, and would have been wrong to publish as the finding. This is the reason we do not report few-example demonstrations as evidence of a trend on this page without also running the trend at scale.
Practical implication: an SNR floor before running the pipeline on new field recordings would reduce, but not eliminate, low-confidence output — near-miss frames (probability 0.3–0.6, likely real vocalisation the model is unsure about) do not show a strong quality trend on their own, so some genuine misses will occur even in clean recordings. We have not yet checked whether any Koe corpus recordings are similarly noisy in a way that could affect the full-corpus figures above; that is open follow-up work, not yet done.
Separately from the population-level analysis above, we picked one SNR-proxy-scored "high quality" recording (Akaroa foreshore, a populated harbour town) to show as an illustrative example. The pipeline confidently (mean confidence 0.89) segmented and labelled ~32 loud, regular transients as bellbird syllable types. On inspection this recording could not be confirmed as clean, unambiguous bellbird song — the SNR proxy measures loudness and regularity in a frequency band, not is this actually a bird, and a loud non-vocal or ambiguous sound in a populated area can score "high quality" under that metric just as easily as a clean bird call can. We could not resolve from the spectrogram or spectral statistics alone whether those transients were real bellbird calls; a listen suggested "maybe a weird, cicada-like call" — genuinely ambiguous, not resolved either way, and we are not asserting a verdict on that specific recording.
The fix: use independent human verification, not an acoustic proxy, to select the illustrative example. Macaulay Library records a community rating (0–5, from independent listeners), a background-species field, and playback/captive flags — a real provenance signal our SNR proxy never had access to. Filtering the 980 Macaulay korimako recordings to rating ≥4.0 from ≥3 raters, no listed background species, not captive, playback not used, left 46 candidates. The current illustrative example on this page (ML 364073421, Lady Alice Island, Northland, January 2020; rated 4.67/5 by 6 independent raters) is drawn from that filtered set: annotated spectrogram and source audio are both published so a reader can check the labels against the sound directly rather than take our word for it.
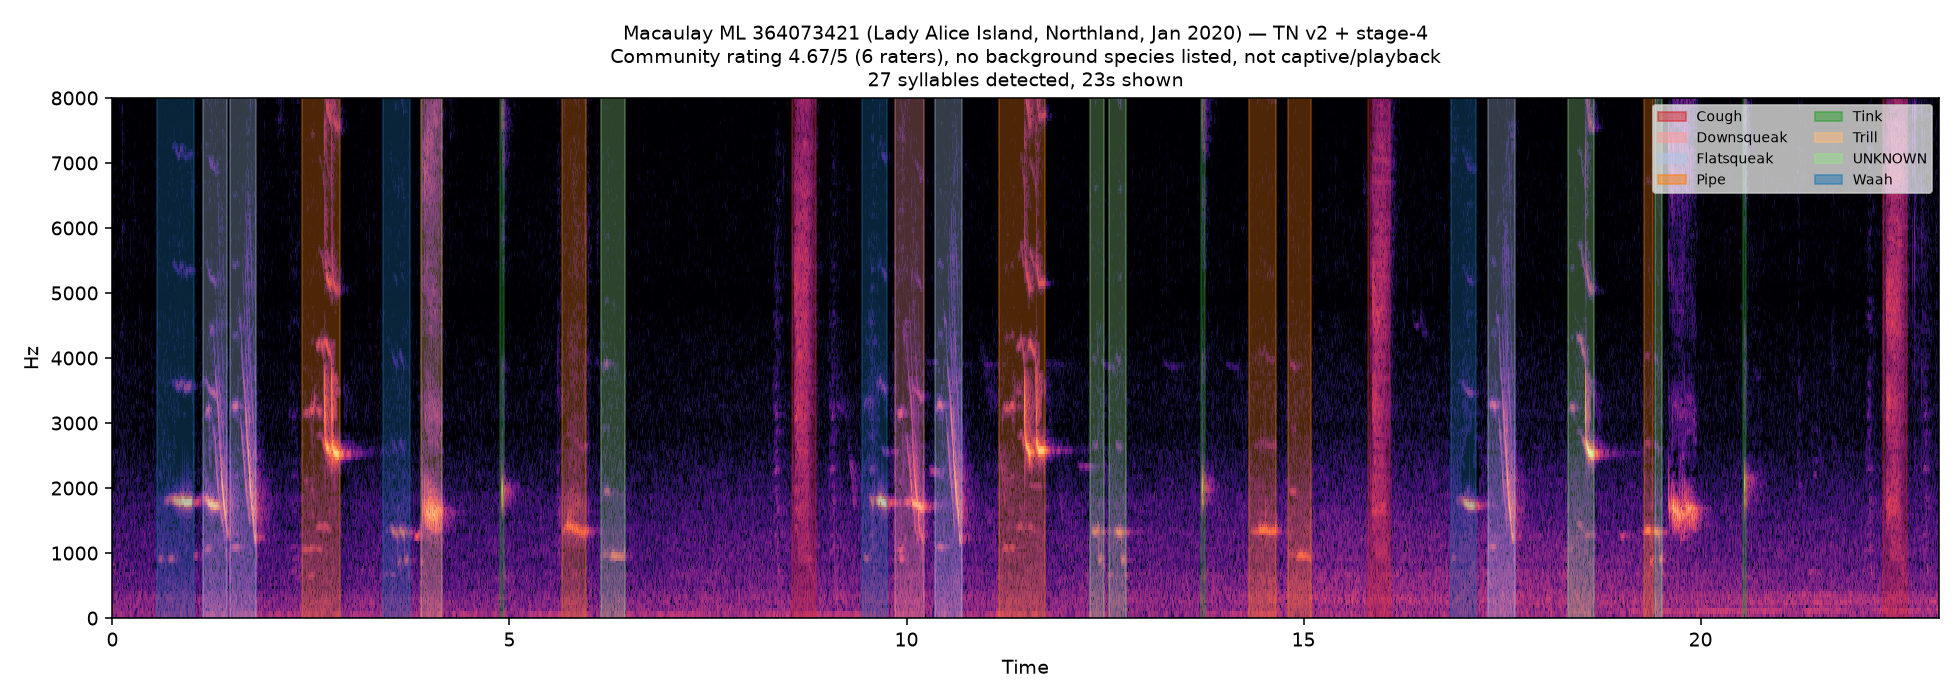
What this changes and what it doesn't: the population-level result (n=607, confidence rising with SNR, Spearman r=0.508) is unaffected — it never depended on any single recording's identity being correct. Only the single illustrative example changed. We are keeping this addendum rather than quietly swapping the figure, because "our first quality metric let an ambiguous recording through as a headline example" is itself informative about the limits of acoustic-only quality proxies for field data with no ground truth.
Beyond the rule-based pipeline, we trained a TweetyNet-style convolutional neural network for syllable segmentation — finding the boundaries of vocal units. It does not categorise syllables; see the 29 July correction below. The model processes raw spectrograms and predicts frame-level labels, then post-processing extracts contiguous segments with confidence thresholds and minimum-duration filtering. This architecture, introduced by Cohen et al. (2022) for birdsong annotation, learns spectral-temporal features directly from data rather than relying on hand-crafted rules.
This page has shown F1=0.784 as the bellbird segmentation result while also stating, three paragraphs below, that the artifact behind 0.784 no longer exists and the number does not reproduce. That is not a tenable thing to keep publishing. Meanwhile the best-provenanced comparison we have has sat unpublished on a lab machine since 29 July. Both halves of that are corrected here. The 0.784 discussion below is retained unedited — it is the record of how we got here.
The current result: CNN F1 = 0.8577, FIR envelope F1 = 0.7212
(Δ = +0.137) on split 88513a3aaa91. Unlike 0.784, this one is a held-out estimate and
both arms were scored the same way. The CNN here is the SpecAugment-trained model — we name
the model because a later run appeared to show augmentation hurting, and that run turned out to be
invalid (it resampled the audio to a rate the model was never trained at, which cost 0.13 F1 on its own).
Whether augmentation helps is currently unknown; see “What we do not yet know”.
| Method | Threshold | P | R | F1 |
|---|---|---|---|---|
| CNN (TweetyNet-style) | 0.45 | 0.846 | 0.870 | 0.8577 |
| FIR envelope | 0.70 | 0.882 | 0.610 | 0.7212 |
15 held-out test files, 246 ground-truth segments. One matching
criterion for both arms — IoU ≥ 0.3 OR overlap ≥ 0.5, greedy by detected length.
Both operating thresholds chosen by argmax F1 on a separate validation split, not on test.
Paired sign test over the 15 test files: 12 favour the CNN, 2 favour FIR, 1 tie,
p = 0.035 two-sided. (The value recorded in the source artifact, 0.0176, is one-sided; we publish
the two-sided figure.) Source: rescore_final_results.json, 29 July 2026.
Now the part that matters more than the number. This is not evidence that the CNN generalises, and we are not claiming that it does.
- n = 15 test files. Every claim on this page about segmentation rests on fifteen recordings.
- One site, one week. All 60 files in this split come from a single site (CUV), recorded across five days of November 2016. There is no second site and no second season.
- Bird-level leakage in both directions. The split is file-disjoint — no recording appears
in two partitions — but it is not bird-disjoint. Of the 12 distinct birds in the test set,
4 also appear in training (AMH015, AMH036, BAE042, WHW021) and 6 also appear in validation
(BAE037, BAE042, BAE047, DHB008, DHB016, WHW021). In one case the annotator's own filename says so:
AMH015_01_M…TrumpetSongSameBirdAsTr014Harmonics.wavis in train andAMH015_02_M…— same bird, same song type — is in test. - The operating point was selected on birds present in the test set. This follows from the two facts above and is the one that does the most damage. The methodology note "threshold tuned on validation, not test" is true at the file level and false at the level that matters, because half the test birds are validation birds.
So read 0.8577 as within-individual, within-site, within-week segmentation performance. That is a real quantity and a reasonable place to be after five weeks. It is not the quantity a reader will assume from "CNN F1 = 0.858", and it does not support "this method works on New Zealand birdsong." A re-split grouped by bird rather than by file is the next measurement, and we expect the number to fall; the size of that fall is the finding, not a failure.
Five open questions that bear directly on everything above. None of these has an answer yet, and we would rather say so here than have a reader discover it. Per the kaupapa this project works under, a finding is a baton and everything the next runner needs to succeed — which means the unresolved parts are part of the finding, not an embarrassment to be tidied away.
- Whether data augmentation helps or hurts — direction unresolved. A 29 July run found augmentation improved F1 (+0.033); a 3 August run found it hurt (−0.078). The two runs are not comparable: the 3 August run's FIR baseline collapsed from 0.721 to 0.424 because the registered baseline was never loaded, and its "augmented" arm reused a borrowed checkpoint rather than retraining. Neither run supersedes the other. We therefore publish no augmentation qualifier on the number above, in either direction, until a clean ablation exists.
- How WhisperSeg compares — currently unmeasurable. WhisperSeg is being evaluated in
parallel, but its scoring counts a prediction correct on any overlap with ground truth, while the
CNN and FIR numbers require
IoU ≥ 0.3 or 50% overlap. A more permissive matcher produces a higher F1 for free. No WhisperSeg-vs-CNN comparison appears on this page and none should be quoted from elsewhere until all three methods are re-scored through the single canonical matcher. This is the same error class we publicly withdrew in July; we are declining to make it a third time. - The annotation ceiling — unmeasured, and it bounds every number here. Every F1 on this page measures agreement with one person's annotations, treated as truth. But where a syllable starts is genuinely ambiguous, and two experienced annotators will disagree. If human annotators agree with each other at F1 ≈ 0.85, then 0.8577 is at the ceiling and further tuning is fitting one annotator's habits. If they agree at 0.97, there is real headroom. We currently cannot tell which world we are in, which makes this the highest-value unmeasured quantity in the project.
- How much of the result survives a bird-grouped split. See the correction above: the current split is file-disjoint but not bird- or site-disjoint. Until the re-split is run, the reported figure cannot be read as generalisation to unseen birds, let alone unseen sites.
- Why the label set was cut from 41 families to 14. The Koe taxonomy carries 41 label families; the trainers filter to 14 by a minimum-count threshold. That threshold is not recorded in any provenance block, so we cannot currently state what fraction of segments the 27 dropped families represent, or how the result moves at a different cut. This is a bookkeeping failure rather than a scientific one, but it is unrecoverable without a re-run.
One more, smaller: the seven CNN spectrogram figures further down this page carry a “CNN prediction (bottom)” legend burned into the image pixels that is false — the panel does not show what the legend says. This is disclaimed in the prose beside them and the figures have deliberately not been regenerated, so the erroneous legend remains visible rather than being quietly repaired.
Until today this section was headed “CNN Segmentation & Categorisation” and described the network as performing “joint syllable segmentation (finding boundaries) and categorisation (classifying vocalisation units)”. No measurement ever supported the categorisation claim, and the model could not have performed the task. It is withdrawn.
The training script read the Koe annotation field seg[3] as the
syllable class. That field is f_mid — a frequency in Hz, not a label. The result was
829 distinct “classes” over 829 segments: one example per class, the class identities
being floating-point frequencies (690.06, 762.34, 770.07 Hz…). No classifier can be trained that
way, and none was.
The segmentation figures above are unaffected: segmentation scoring uses only the blank/non-blank distinction, so the spurious classes never enter precision or recall. If anything they penalise the model, since a segment is terminated whenever the predicted class changes. But every statement on this page about the network identifying syllable types was false.
Two knock-on errors, corrected today. The dataset table below listed the Koe
corpus as having 3 label types — neither the 829 the model was trained on nor the 74 the corpus
actually contains. And the multi-species section offered bellbird:click as an example of a
species-prefixed label; the real labels in that run are frequencies with a species prefix, e.g.
bellbird:1018.63239577395.
The real taxonomy was never loaded. segment.extraattrvalue.json, sitting
beside the file that was parsed, holds 13 families and 74 labels — Stutter, Alarmy, Pipe,
Flatsqueak, Down, Chortle, Cough. A retrain against it is underway. Until that produces a validated result,
this project has no syllable classifier and no categorisation performance to report.
An earlier version of this section claimed the CNN's advantage was “more dramatic on the Donald toutouwai dataset”, and that the CNN “learns spectral change patterns that signal phrase boundaries even when the amplitude envelope is flat”. No measurement supported that claim when it was published — no CNN toutouwai evaluation existed at the time. The claim is withdrawn. What we can actually say is below.
Toutouwai: the CNN has not yet been validly evaluated, and on the one weak evaluation that does exist it loses to both classical baselines. The multi-species augmented model (the architecture described below) scores F1=0.262 (P=0.311, R=0.226) on toutouwai over 13 test files — against FIR F1=0.306 and spectral flux F1=0.329. On the evidence we have, the classical baselines currently win on toutouwai. That 0.262 is itself a weak measurement: 13 test files, and the confidence threshold was chosen by taking the argmax over a sweep run on the very files being scored, so it is not a held-out estimate either. Read it as “not yet properly measured, and no sign of an advantage” — not as a firm ranking in either direction. The hypothesis that a CNN should handle toutouwai's sustained tonal phrases (median 971ms) better than amplitude-envelope methods remains untested.
Bellbird (Koe): F1=0.784 (P=0.753, R=0.818, median boundary error
13.3ms) — from a bellbird-only run, 100 epochs
(cnn_segmentation_results_v3.json). This is not a held-out estimate. That file
contains a configuration, a six-point confidence-threshold sweep, and the argmax over that sweep. There
is no validation split, so the threshold was selected on the same data the score is reported on. 0.784
is an optimistic upper bound on that configuration, and for the same reason it is not directly
comparable to the FIR amplitude-envelope baseline (F1=0.731, 31.5ms boundary error), which had no
equivalent tuning freedom.
The head-to-head against the FIR baseline is withdrawn: the two were not
scored the same way, and on the fairest comparison available the classical method is not behind.
The CNN counts a detection as correct at IoU > 0.1
(tweetynet_v3.py:188); the FIR baseline was held to
IoU ≥ 0.3 or 50% overlap (validate_fir_segmentation.py:201, recorded in its
own output as matching_criteria). The quoted 0.731 is also FIR's test-split row
(376 ground-truth segments), while the CNN's 0.784 is over a different split (499 segments). Scored
across the full 829-segment dataset at its stricter threshold, FIR reaches F1=0.786
(P=0.857, R=0.725) — level with the CNN's 0.784 while being judged more harshly. Until both are
re-scored on one split under one matching criterion, treat the CNN as not demonstrated to beat the
classical baseline on bellbird.
Reproducibility: the artifact behind 0.784 no longer exists, and the number does not reproduce. None of the training scripts set a torch seed — only the file-level split is seeded — so weight initialisation and batch shuffling differ on every run. On 27 July 2026 the same script was re-run on the same data and wrote to the same filename, replacing the artifact this figure was read from; the re-run scored F1=0.767 (P=0.726, R=0.814) at the same selected threshold of 0.3. The originally published values survive only in a snapshot taken minutes beforehand. We report this rather than quietly restating the new number, because the honest content of the finding is that this measurement has a run-to-run spread we never characterised, and that results were being overwritten in place instead of written to run-stamped paths.
Our two bellbird runs disagree and we cannot yet reconcile them.
A separate 50-epoch bellbird run over 15 test files (cnn_bellbird_large.json) gives
F1=0.361 (P=0.638, R=0.251, median boundary error 49.7ms) on the same dataset. The two runs differ
in epoch count, spectrogram settings and minimum-segment duration, and share no defined test split, so
neither supersedes the other. Until a run with a proper held-out split settles it, treat bellbird
segmentation performance as unresolved between 0.361 and 0.784, and treat 0.784 as the most
favourable configuration we have run rather than as the headline result.
The multi-species architecture below is a different, worse model — do not
attach 0.784 to it. The joint multi-species training and augmentation described in the rest of this
section correspond to cnn_multispecies_augmented.json, whose combined score is
F1=0.259 (P=0.311, R=0.222): bellbird F1=0.308 on 2 test files, toutouwai F1=0.262 on 13.
The 0.784 figure came from the bellbird-only model and says nothing about this configuration.
Architecture
- Input: Log-scaled spectrogram (500–10kHz, z-score normalised per file)
- Encoder: 3-layer Conv2D (32→64→128 channels, 5×5 / 5×5 / 3×3 kernels) with BatchNorm + ReLU
- Temporal: Frequency pooling → 2-layer bidirectional GRU (256 hidden, 0.3 dropout)
- Output: Frame-level labels (N classes + 1 blank). Only the blank/non-blank distinction is used for segmentation — per the 29 July correction, the class dimension was misconfigured and carries no syllable-type information.
- Loss: Weighted Cross-Entropy (blank weight = 0.15–0.25, tuned per species)
- Post-processing: Confidence threshold sweep (0.3–0.9), minimum segment duration filtering, IoU > 0.1 matching against ground truth
Multi-Species Training
The CNN trains jointly on annotated datasets from multiple species, with species-prefixed labels to avoid
category collision across corpora. This allows a single model to segment vocalisations across species
with different acoustic structures — bellbird's 55ms discrete syllables vs toutouwai's 971ms sustained
phrases. Correction (29 July 2026): this previously read “segment and categorise” and gave
bellbird:click as an example label. In the run described here the labels are frequencies rather
than call types (e.g. bellbird:1018.63239577395), so no cross-species categorisation was
performed.
| Dataset | Species | Recordings | Segments | Label types | Source |
|---|---|---|---|---|---|
| Koe | Bellbird (korimako) | 60 | 829 | 74 † | Fukuzawa et al. (2020) |
| Donald | Toutouwai (NI robin) | 124 | 10,357 | 73 | Harry Donald, Shaw Lab (VUW) |
| Campbell | Kākā | — | — | — | Fraser Campbell, Shaw Lab (VUW) — forthcoming |
† Corrected 29 July 2026. This
cell previously read “3”. The Koe corpus carries 74 syllable labels across 13 families
(segment.extraattrvalue.json); the CNN described above was mistakenly trained on 829 frequency
values instead. See the 29 July correction.
Data Augmentation
To make the model robust to the heterogeneous recording conditions across datasets — studio (Koe) vs field (Donald, Campbell) — we apply six augmentation techniques during training, each with 30% probability per sample:
- Time stretch (±20%) — handles different phrase/syllable durations across species
- Frequency shift (±2 spectrogram bins) — simulates different microphone frequency responses
- SpecAugment time masking — forces the model to learn from partial spectrograms (Park et al. 2019)
- SpecAugment frequency masking — same, for the frequency axis
- Additive Gaussian noise (1–5% of signal std) — simulates varying background noise levels (forest ambient vs studio silence)
- Volume jitter (±20%) — handles different microphone distances and recording gains
Segmentation Demonstration
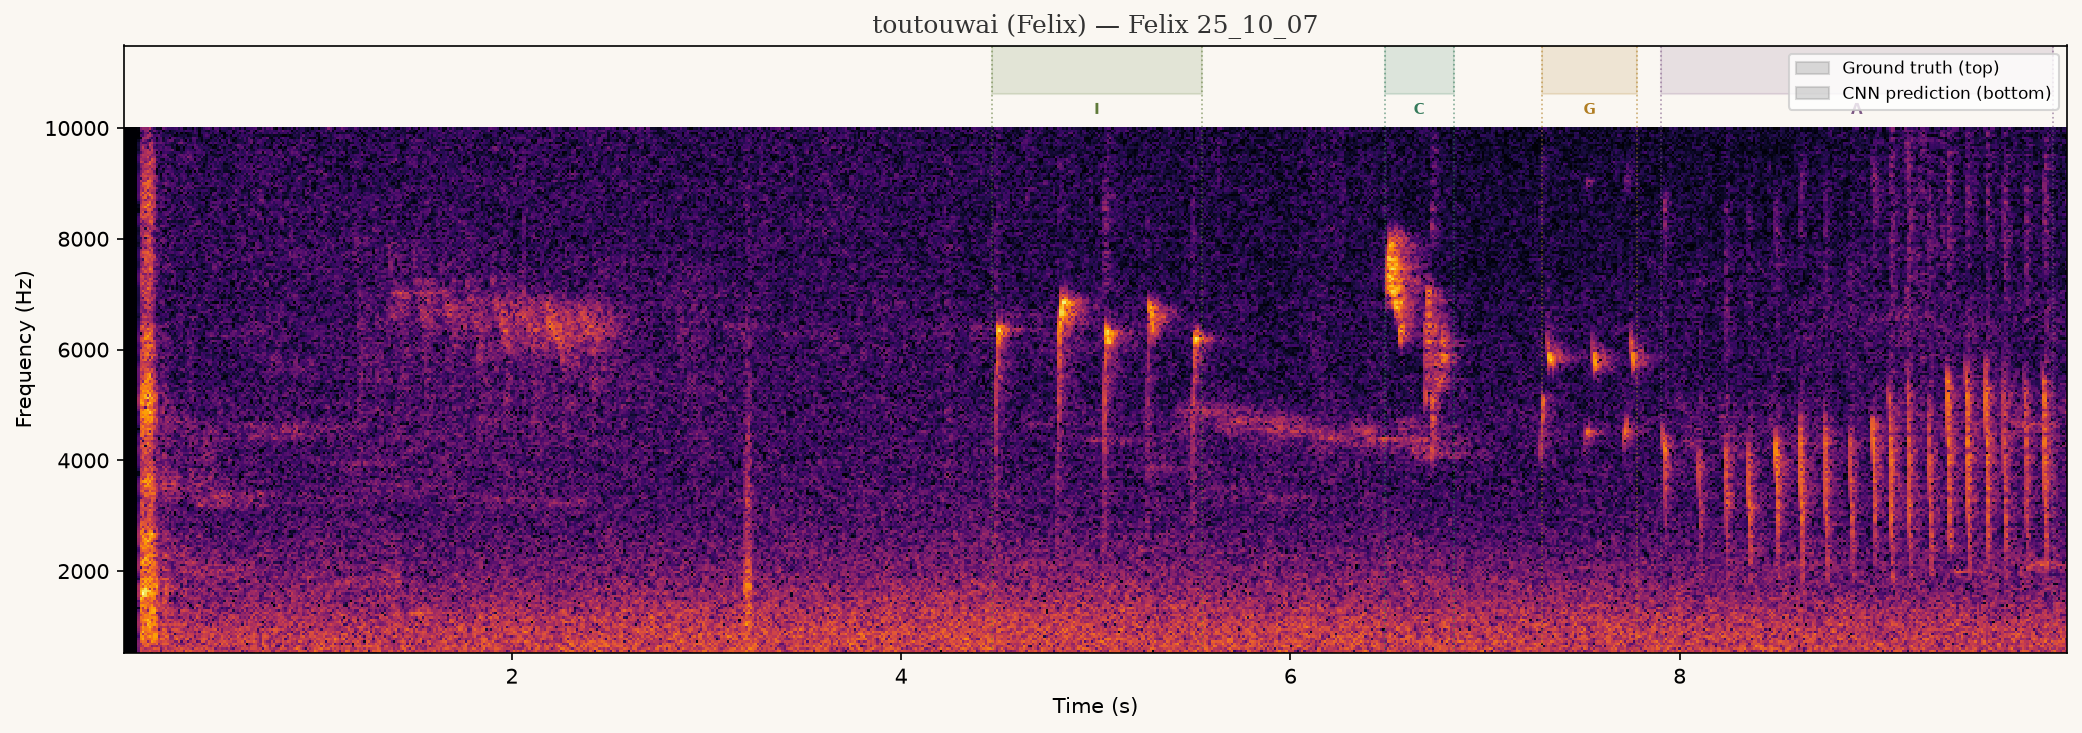
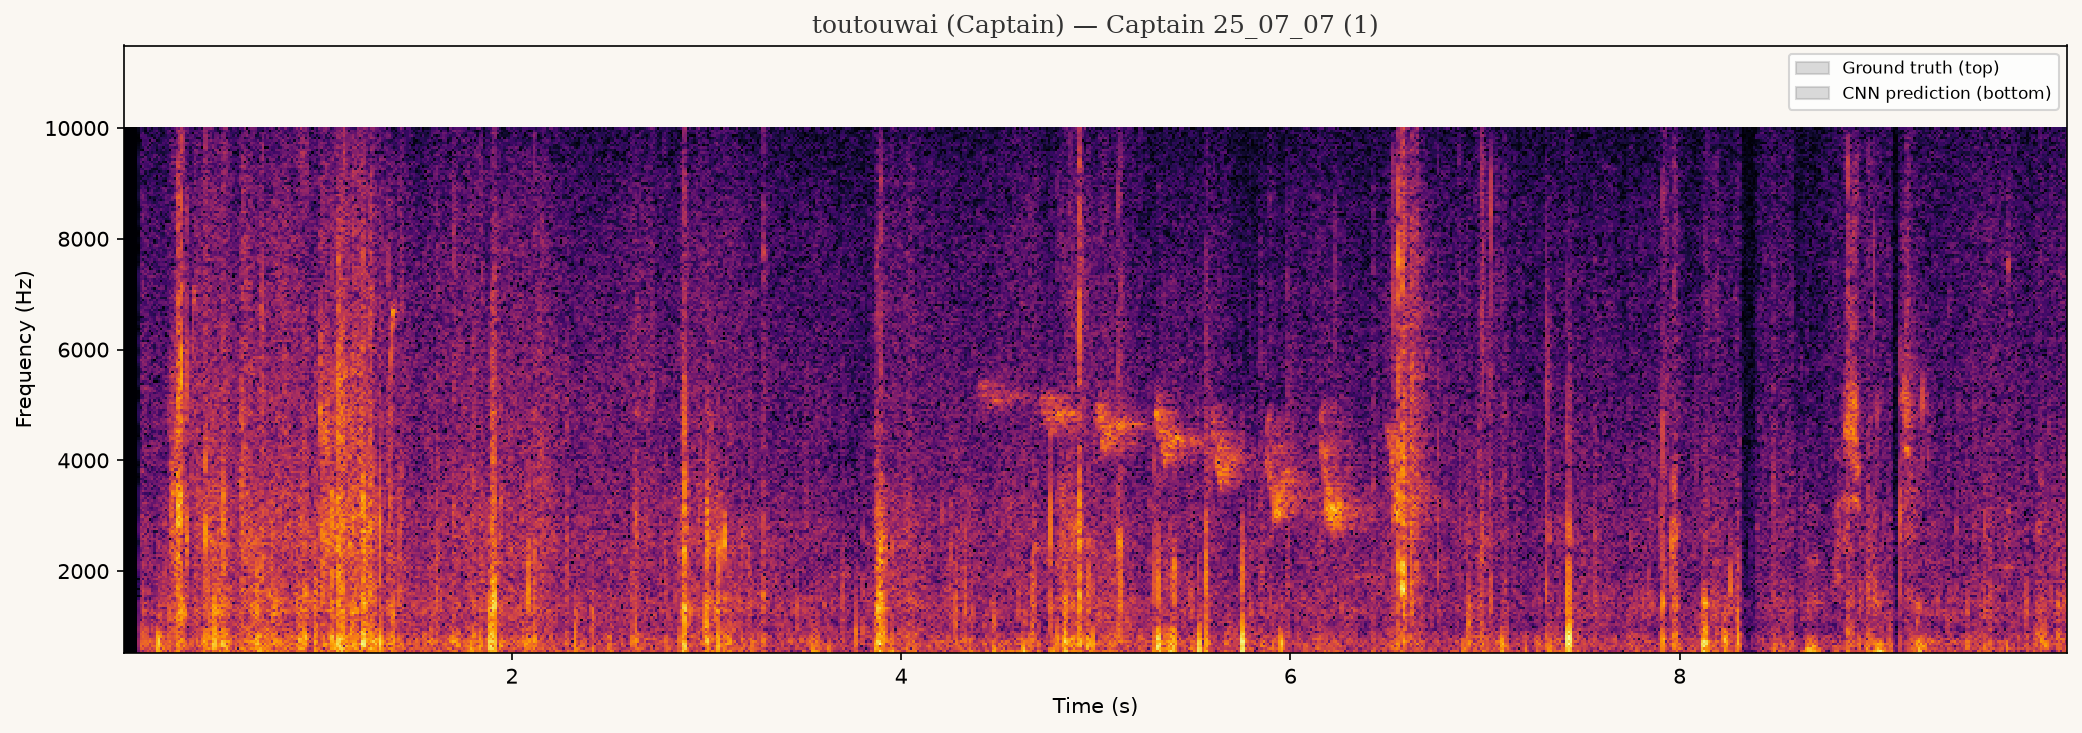
The spectrograms below show ground-truth annotations only — the top bands, dotted boundary
lines and category labels are all human annotation. They contain no CNN output. The figure generator
stamped every image with a “CNN prediction (bottom)” legend entry unconditionally, but the run
that produced these images emitted zero predicted segments on all seven examples:
cnn_spectrograms/examples.json records n_pred = 0 for every entry (toutouwai
Felix, for instance, is n_gt = 61, n_pred = 0). The legend printed inside the images is
therefore false — the captions below are the correct description, and the generator has been fixed
so that future figures only claim a prediction band when one exists. CNN overlays will be added when a run
actually produces segments on these files. These examples come from recordings held out of training.
Toutouwai — Felix (Donald dataset)
Toutouwai — Captain (Donald dataset)
Korimako — Koe bellbird (studio recording)
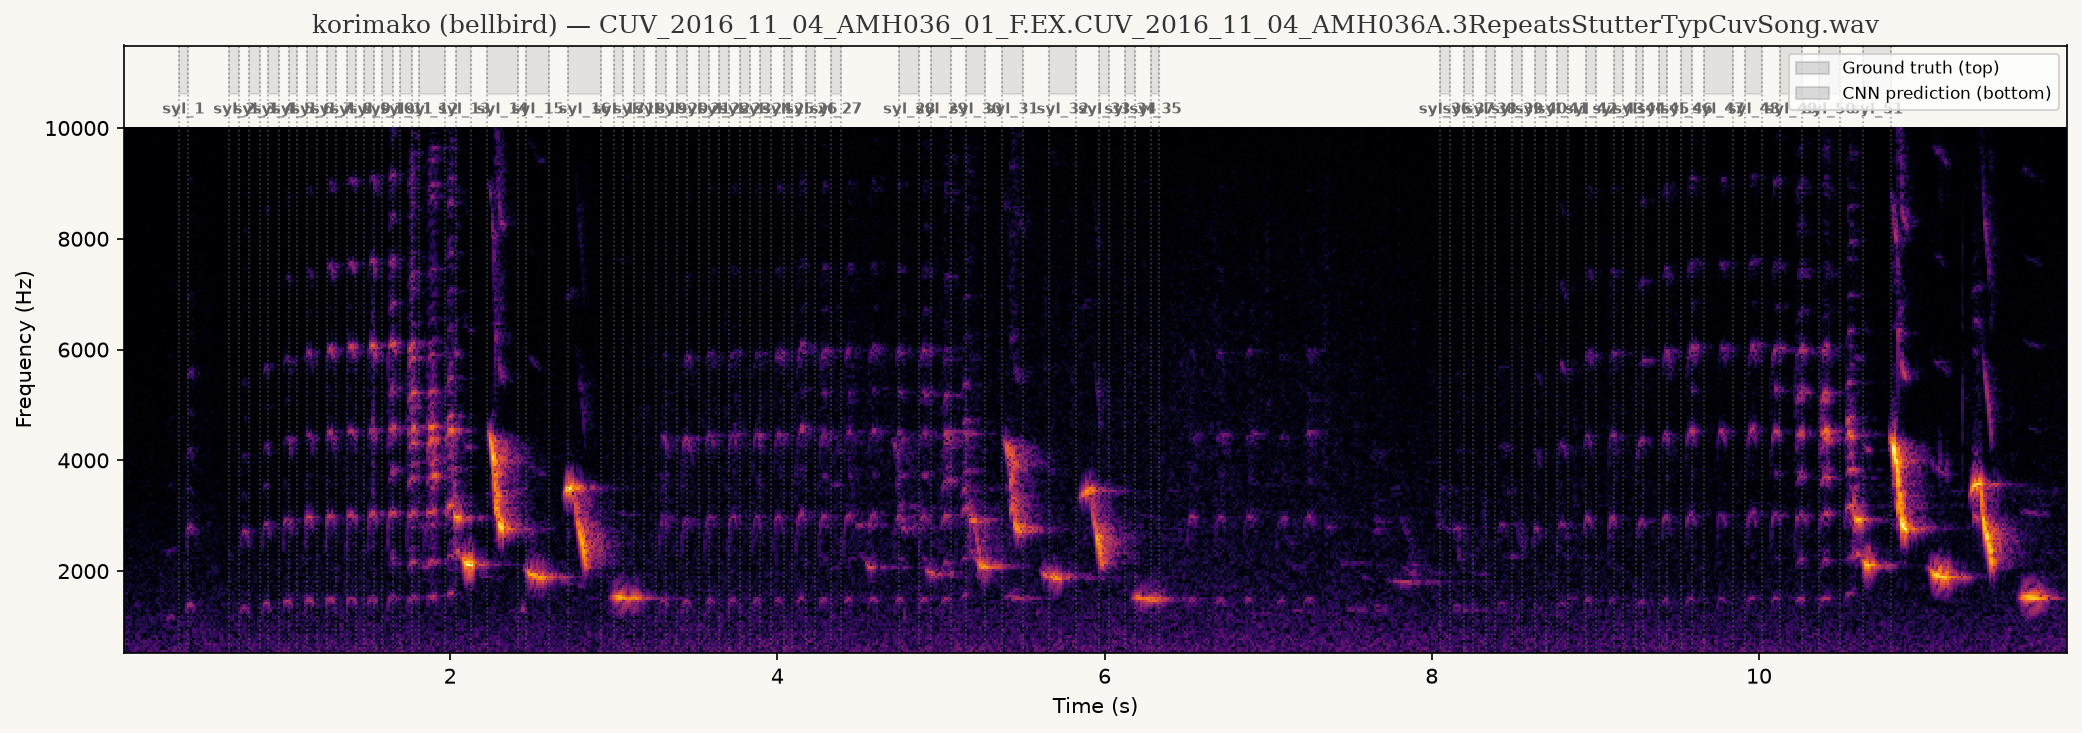
Ground-truth annotations only, above. Training has in fact completed — the reason there are no overlays is that the completed run predicted no segments at all on these seven files, not that it has not been run yet.
Sample Size Adequacy — Entropy Rarefaction
To verify our sample sizes are sufficient, we computed Shannon entropy rarefaction curves — subsampling recordings at each N (100 iterations) and measuring whether the entropy estimate stabilises. A plateau means adding more recordings would not substantially change the proportional distribution of vocalisation types.
Entropy vs Recording Count
All three species reach stable entropy by ~15–20 recordings. Tūī (now 232 recordings, was 116) and korimako (now 94, was 40) are well past the plateau. Kākā (now 47, was 25) has also cleared it comfortably — no longer sitting right at the threshold. Sample sizes across all three species doubled this session; this confirms that our sample sizes are adequate for characterising the proportional distribution of vocalisation types — though not necessarily for capturing rare types (e.g., the absent shraak calls). Note: the rarefaction curve chart below still reflects the pre-expansion sample sizes (116/40/25) — a rebuild with the doubled corpus is queued as follow-up work; the qualitative conclusion (all species plateau well before their full N) is expected to hold and, if anything, strengthen.
Inclusion threshold. On this basis we set a minimum of 20 A-quality recordings as the criterion for reporting a species' proportional repertoire. This is the point by which all three species' entropy curves have flattened to within ±1 SD of their full-sample value, so a species meeting it can be characterised without the estimate being dominated by sampling noise. All three focal species now clear the bar comfortably (kākā, previously right at it with 25, now has 47). The threshold governs only the proportional-distribution claims; detecting rare vocalisation types (present at <5% prevalence) requires substantially larger samples and is treated as out of scope here.
Reproducibility
The full analysis pipeline is available at github.com/cyborg-garden/open-science. The Python venv uses librosa for audio analysis and scikit-learn for clustering. All Xeno-Canto recordings are publicly available via their API.
Process Transparency
This dashboard was compiled by Matilde, an agentic open-science research assistant. The full chain-of-thought trace — every API call, every decision, every error and retry — is published alongside the dashboard for complete reproducibility. This is not a black-box result.
The tūī vocal repertoire has been studied primarily by S.D. Hill and colleagues at Massey University. Their work at Tawharanui Regional Park established the foundational syllable categorisation scheme we replicate here. All citations below have been verified against Crossref.
All citations below remain valid — they are the ground-truth sources and conceptual frameworks this project draws on. What has changed is which one drives the current korimako figures: Hill & Ji's five/six-category rule-based scheme is the live method for tūī, but for korimako it has been superseded by a stage-4 classifier trained directly on the Fukuzawa et al. (2020) Koe hand-labelled corpus (24 families, 0.893 test accuracy) — see the Methodology tab's "Current pipeline" note. Kākā uses the Van Horik (2007) / Vaishnav (2026) call-type frameworks, unchanged.
Syllable Categorisation Replicated
Hill & Ji (2014) established six syllable categories for tūī song at Tawharanui: low-frequency, high-frequency, harmonic, trill, RMNR, and harsh/other. Harmonic syllables were the most common (~15%). Our automated pipeline captures five of six categories but finds different proportions — low-frequency dominates at 56%.
Hill, S.D. & Ji, W. (2014). Notornis, 61, 54. DOI: 10.63172/301002sqblid ✓Song Complexity & Aggression Concordant
Hill et al. (2017) showed that more complex tūī songs elicit stronger aggressive responses from territorial males — "fighting talk." This motivates the repertoire analysis: if song complexity varies geographically, it may signal different competitive environments.
Hill, S.D. et al. (2017). Ibis, 160(2), 257-268. DOI: 10.1111/ibi.12542 ✓Automated Recognition Review Methodological basis
Priyadarshani et al. (2018) reviewed automated birdsong recognition in complex environments — the methodological landscape our pipeline operates in. Key challenge: noise robustness. XC recordings have variable SNR, unlike controlled setups.
Priyadarshani, N. et al. (2018). J. Avian Biology, 49(5). DOI: 10.1111/jav.01447 ✓Microgeographic Song Variation
Hill et al. (2015) documented microgeographic variation in tūī song within the Tawharanui population. Our dataset — spanning the entire country — enables a macro-scale version of this analysis, comparing repertoires across Auckland, Wellington, Southland, and beyond.
Hill, S.D. et al. (2015). NZ J. Ecol., 39(2), 261-269 ✓Chatham Island vs Mainland
Hill et al. (2013) compared tūī vocalisations between Chatham Island and mainland populations, finding differences attributable to isolation and smaller population size. Xeno-Canto data includes offshore recordings that could extend this work.
Hill, S.D. et al. (2013). Notornis, 60, 222-229 ✓Korimako syllable classification follows the Massey University group (Brunton, Roper, Webb, Fukuzawa). Their framework treats syllable types, not song types, as the functional units of vocal culture. Citations verified against Crossref.
Sexually Distinct Song Cultures Framework
Webb et al. (2021) classified 20,700 syllables (702 types) across a six-island korimako metapopulation, showing males and females have distinct song cultures sharing only 6–26% of syllable types within a site. This is the classification framework and the sex-difference result our song-structure analysis builds on.
Webb, W.H. et al. (2021). Frontiers in Ecology and Evolution, 9, 755633. DOI: 10.3389/fevo.2021.755633 ✓Developmental Song Production Syllable boundary
Roper et al. (2018) studied developmental changes in song production in free-living male and female bellbirds. We adopt their <15ms silence syllable boundary — shorter than the tūī boundary — reflecting korimako-specific vocal structure.
Roper, M.M. et al. (2018). Animal Behaviour, 140, 57-70. DOI: 10.1016/j.anbehav.2018.04.003 ✓Koe Classification Software Tool + dataset + current korimako typing scheme
Fukuzawa et al. (2020) introduced Koe, web-based software for classifying acoustic units, demonstrated on 21,500 korimako syllables. Our data-driven song-structure analysis uses the Koe tutorial dataset (2,278 songs, 21,427 hand-labelled segments) as its ground-truth source — and, as of the 24 August 2026 pipeline update, the 24-family label scheme from this dataset is what our stage-4 classifier predicts for every korimako syllable on the live dashboard (0.893 test accuracy).
Fukuzawa, Y. et al. (2020). Methods in Ecology and Evolution, 11(3), 431-441. DOI: 10.1111/2041-210X.13336 ✓Kākā are parrots, not songbirds — they produce calls, not songs. Two frameworks are relevant.
Kākā Vocal Ethology Call types
Van Horik, Bell & Burns (2007) identified five distinctive kākā call types through 500 hours of field observation and spectrographic analysis. This is the classifier applied to our Xeno-Canto kākā recordings (snicker, bark, gurgle, shraak, shraak-woo).
Van Horik, J., Bell, B. & Burns, K.C. (2007). New Zealand Journal of Zoology, 34(4), 337-345. DOI: 10.1080/03014220709510093 ✓Partial Nocturnality & Call Repertoire Current scheme
Vaishnav, Shaw & Burns (2026) describe kākā vocal behaviour including a five-call-type scheme (whistle, screech, long call, croak, warble). Our annotation and template-matching tools use this newer scheme, with audio templates provided by the lead author (Burns lab, VUW).
Vaishnav, T., Shaw, R. & Burns, K. (2026). Journal of Field Ornithology, 97(2), art8. DOI: 10.5751/JFO-00813-970208 ✓✓ Full tūī analysis: All 232 A-quality song recordings analysed — 36,268 syllables across 5 types (doubled from 116/17,716 this session; distribution essentially unchanged, confirming the smaller sample wasn't distorting the tūī findings).
✓ Korimako comparison: 94 A-quality recordings (doubled from 46), 13,086 syllables. Stutter still dominates but dropped from 62.8%→56.1% as click grew 19.4%→24.1% — a real shift with the larger sample, not noise.
✓ Kākā comparison: 47 A-quality recordings (doubled from 25), 1,790 calls. Simpler call-dominated repertoire vs honeyeater song; snicker dominance strengthened slightly (80.9%→85.5%).
✓ Geographic variation: Now 13 regions for tūī with the doubled sample (was 10). Prose below reflects the original 116-recording pass — regional breakdowns are queued for a refresh with the new 232-recording data (see Methodology note).
✓ Unsupervised clustering: HDBSCAN on 32-dim MFCC+spectral features. Resolved the low-frequency discrepancy: 93.9% of "low-frequency" syllables have centroids above 2kHz — it's a threshold-ordering artefact in our rule-based classifier, not a biological disagreement with Hill.
✓ Data-driven korimako categories: On the Koe dataset, 818 syllables were PCA-embedded (spike-sorting style), manually clustered into 10 categories, then DTW-barycenter templates classified the rest — feeding the song-structure analysis (transitions, motifs, sex & site differences). Explore it via the PCA clustering tool and annotation tool.
✓ Korimako sex & song: Site-honest sex classifier (leave-one-island-out) shows the male↔female song difference generalises across dialects — 80.5% on never-seen islands vs 59.5% chance — so it isn't a site artefact. A bird's position on that axis is a stable individual trait (repeatability ICC = 0.67); feature attribution + a length ablation show intermediacy is genuine multi-feature sex-atypicality, not song length. Flags a small non-binary group and a rarer sex-atypical ("trans") group as leads for audio audit. See the Sex & Song section under Vocalisation → Korimako.
Future work — temporal analysis: How has the XC archive's tūī song changed over decades? Do more recent recordings capture different repertoires? Seasonal and temporal patterns will be explored in a future species-specific analysis.
Next — tūī template matching: Apply the same PCA → manual-cluster → DTW-template pipeline used for korimako to tūī, and extend to additional species (tīeke, kōkako) and datasets (AviaNZ kiwi).