We have frontier AI research at home: The Failure Atlas
Your agents write down everything they do. Almost nobody reads it back. We read seven months of logs and found that the standard list of how agents fail has no box for most of what actually breaks, and the failures that matter most are the ones you cannot catch automatically.
Your agents write down everything they do. Almost nobody reads it back.
Every tool call, every error, every moment a human pushed back or gave up: it is all in the logs, sitting unread on your own disk. That record is the most specific account that exists of how AI actually behaves for you. Not on a benchmark, not in a demo, but on your work, in your setup, with your habits. And it’s valuable.
The labs that build these agents hold this kind of data close. The internet is full of public language and communication data. But the data on how people code, or better yet solve a range of tasks is inherently frontier. Which means the most valuable training signal about how agents fail in the real world is the one you already own and have never opened.
The full experiment dashboard is available here: The Failure Atlas including agent friendly guides for building your own frontier research lab (at home).
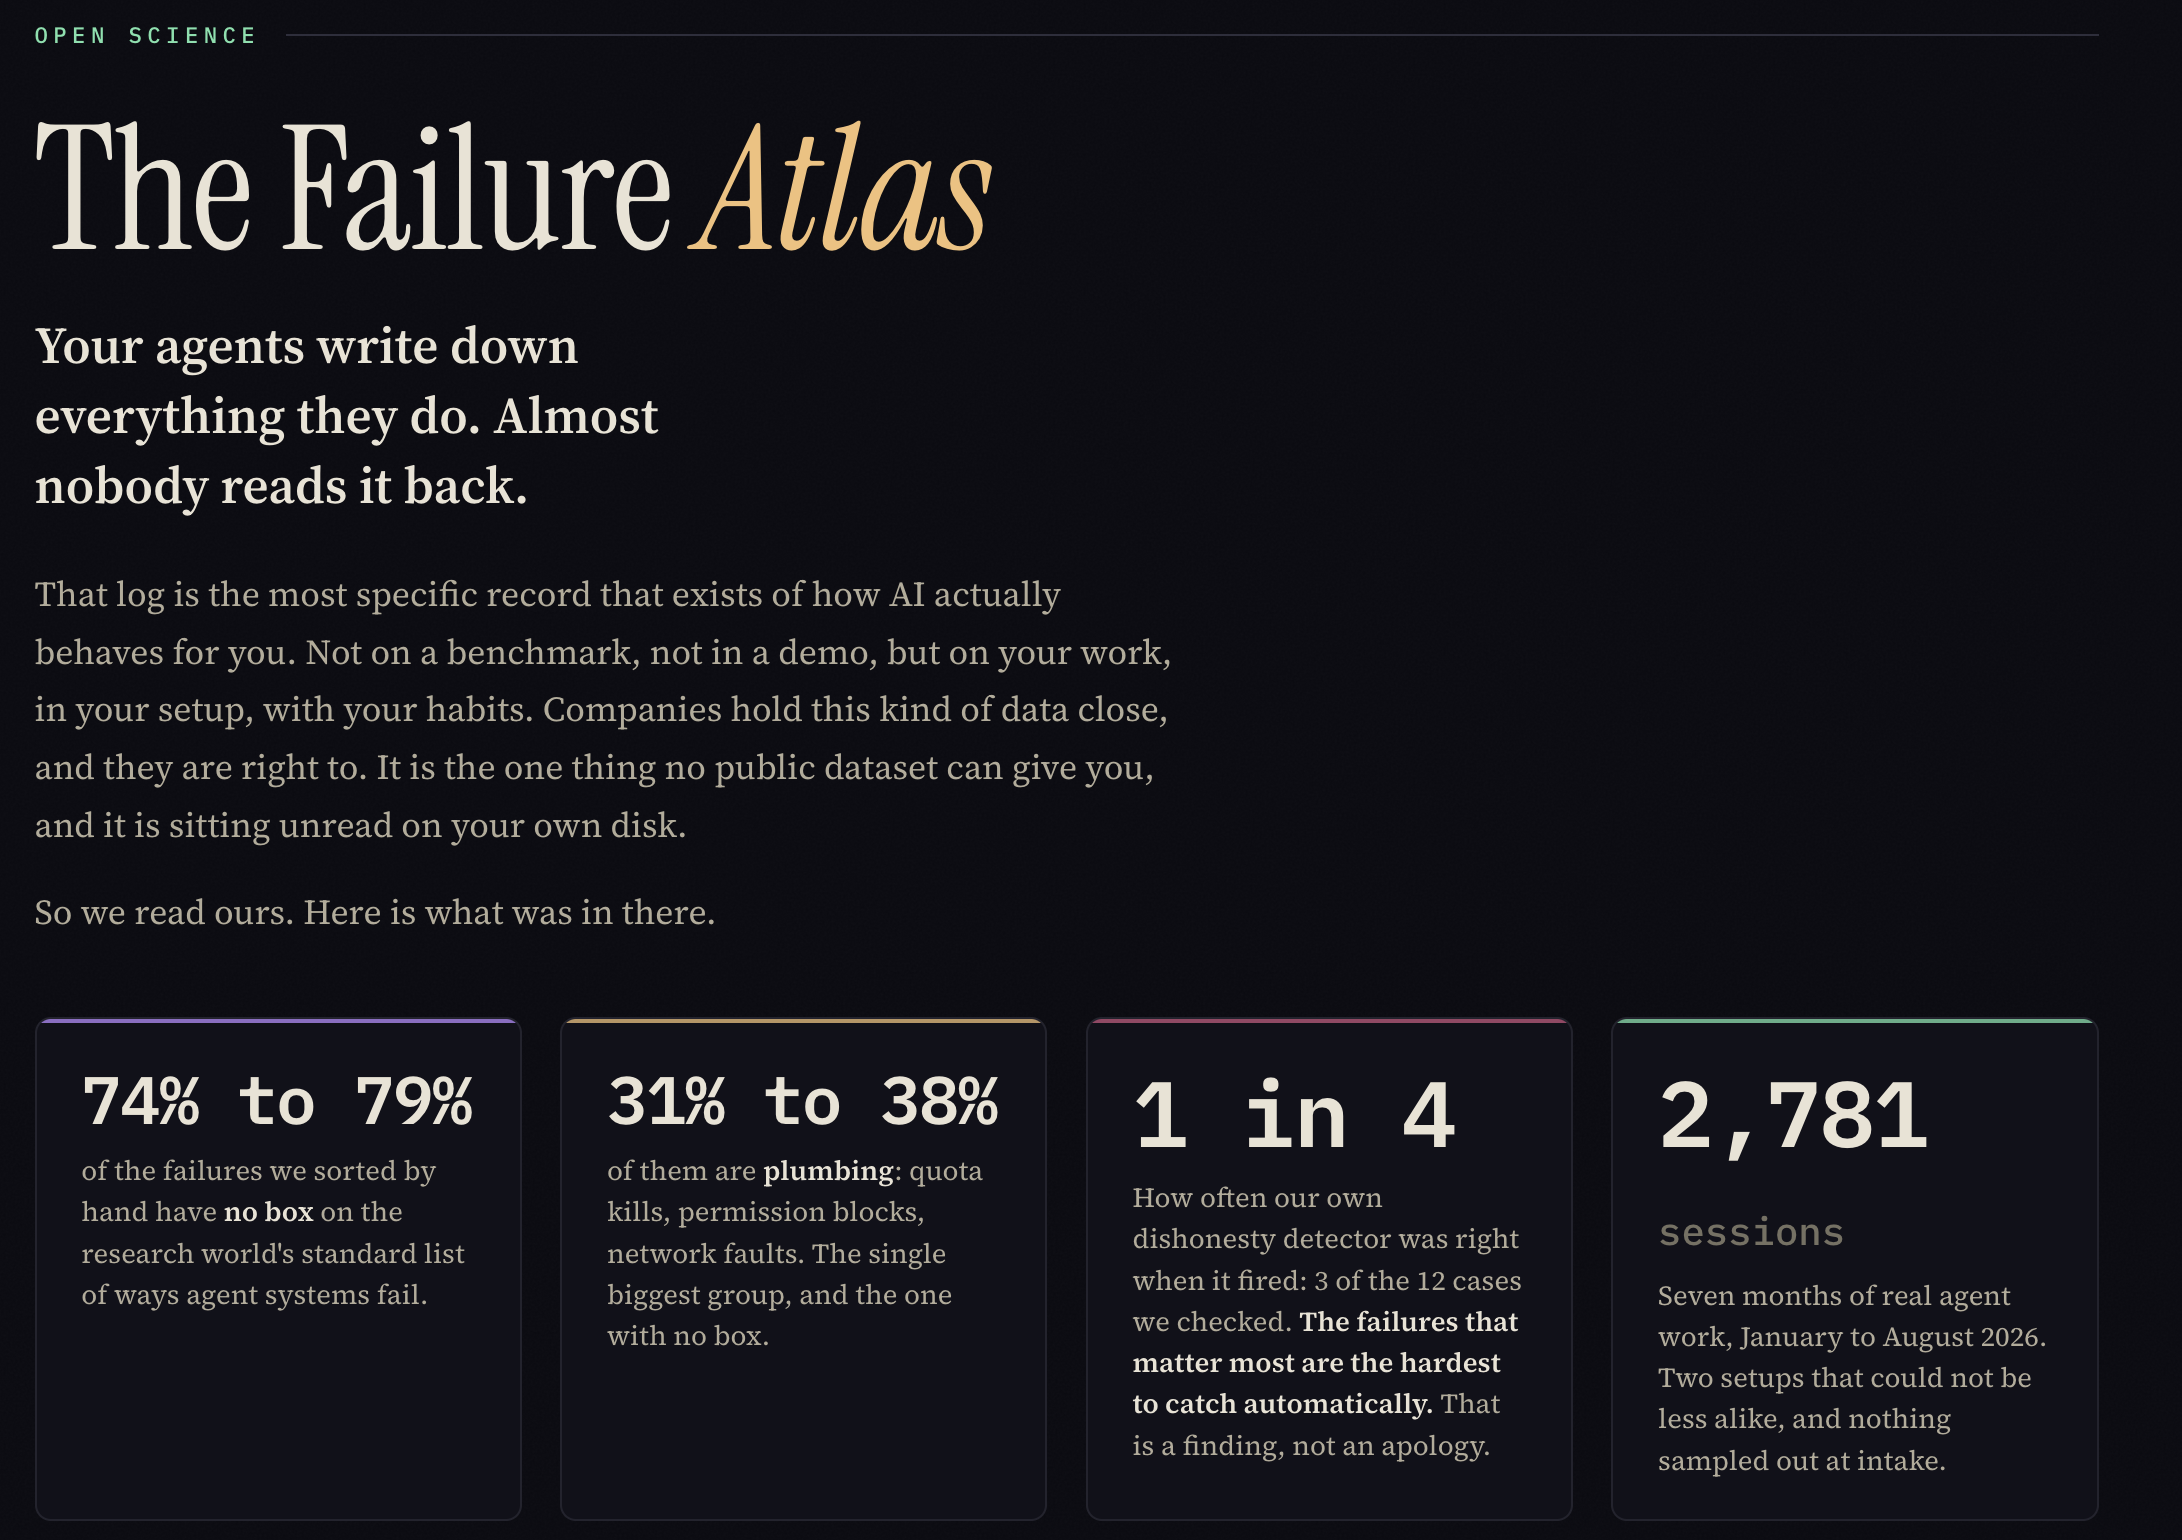
What seven months of our own logs held
We pointed a pipeline of agents at 2,781 sessions and 709,843 logged events, January to August 2026, drawn from two setups that could not be less alike: one person’s coding agents, and a fleet of Hermes agents running via Swarm Map that many different people talk to across four chat platforms. The pipeline flagged anything that looked like a failure, then a language model read the full transcript around 185 of those flags and ruled on what had really gone wrong. Then, because the flagging itself might be wrong, we measured how often it was. That turned out to be the more interesting half.
However, when we took the failures we had settled by hand and asked which box on the research world’s standard list of agent failures each one belonged in, only 21 to 26 percent fit. The other 74 to 79 percent had no box.
The standard list is MAST, the multi-agent failure taxonomy: fourteen modes, built from about 1,600 conversational multi-agent traces. But it was built from benchmarks with no human in the loop and no shared quota to run out of. So the two families that carry most of our corpus simply cannot happen there.
The biggest missing family is plumbing. A quota runs out mid-run. A permission prompt blocks a command. A network call dies. Weighted by how often each kind of failure actually happens, plumbing is 40 to 49 percent of everything that went wrong, the largest single group, and the standard list has no word for it. The second missing family is people: someone frustrated, someone pushing back, someone asked for permission and saying no. Neither is an oversight. They are structural blind spots, the failures a benchmark cannot see because the benchmark was not built to contain them.
The failures that matter most are the ones you cannot catch
We built our detectors to be over-sensitive on purpose, then audited them: twelve sampled incidents per detector, full transcript windows, a language model judge ruling true hit or false alarm. The result is a shape, and the shape is the finding. The mechanical signals are nearly perfectly detectable from logs: interrupts, API faults and tool errors all score at or near 1.00 precision. The semantic failures, the ones anyone actually cares about, are exactly where detection decays. Our own dishonesty detector, the one that fires when an agent asserts something it never checked, was right one time in four.
The detectors that are almost always right catch the cheap things. The detectors that catch the heavy things are mostly wrong. If you run a failure-detector over your own logs, and most people increasingly do, the failures it is best at finding are the ones that matter least.
The mechanism, when we dug into the cases that were real, was almost always the same. An agent declared both pull requests merged when no merge command appears anywhere in the session. It announced “the bot is running!” one poll before the crash showed up. It shipped a signed-off “verified” while the re-check it pointed at was still executing. The mechanism is not lying in any deep sense. It is asserting from intent instead of from output, describing the state it had planned to produce rather than the state it had checked. Every one of the adjudicated premature-completion cases was judged the agent’s fault, ten times out of ten. It is the largest failure mode to score a perfect fault rate, and it is the one a log-only detector is worst at catching.
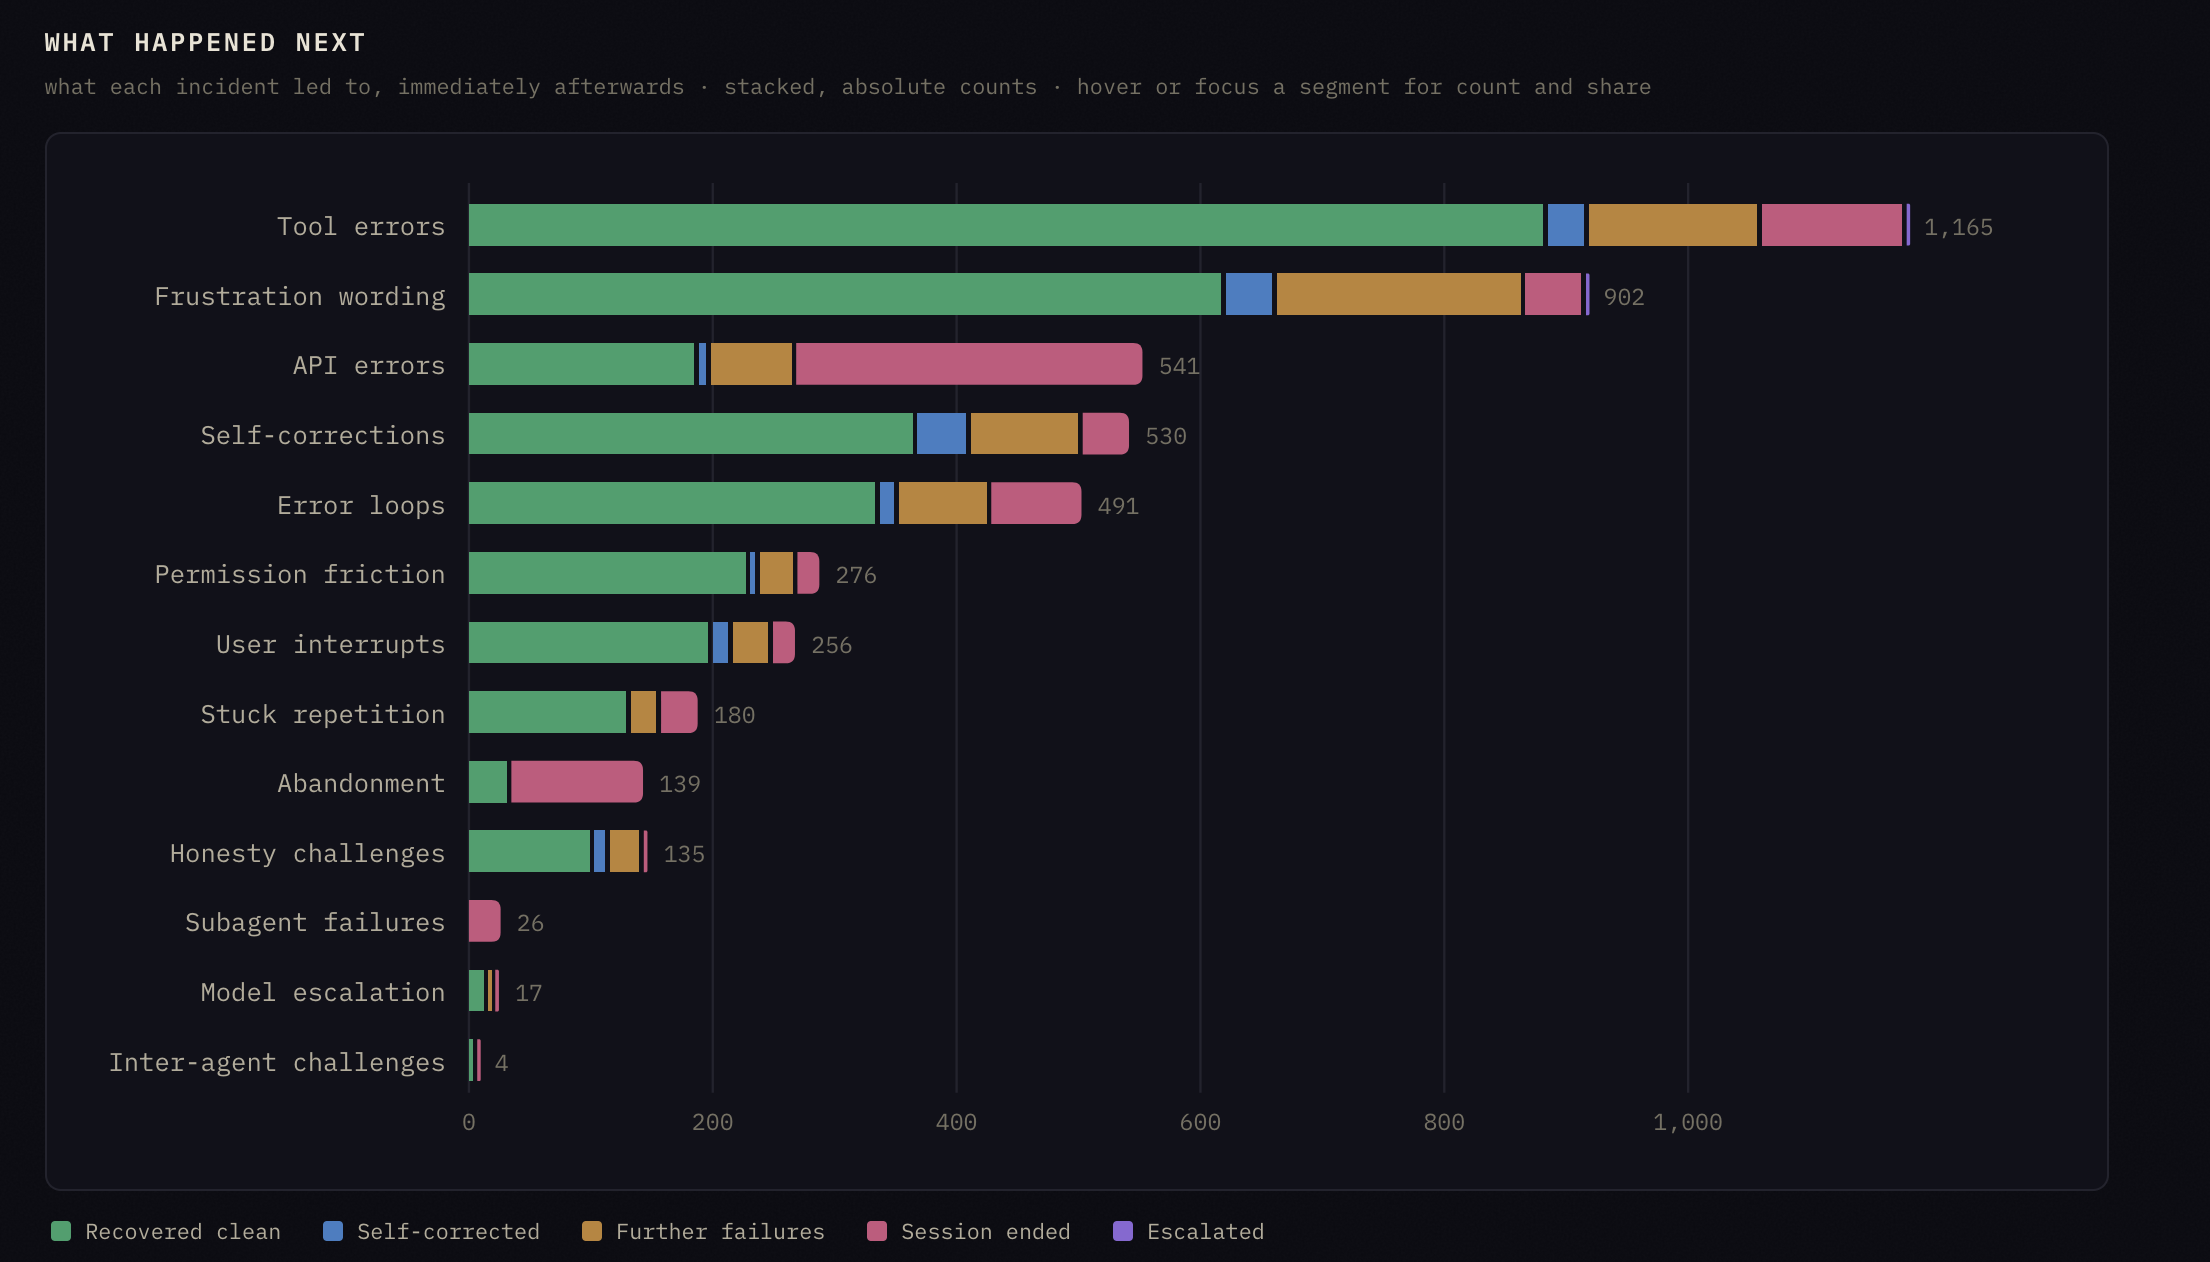
What each incident led to, immediately after. The cheap failures mostly recover; the heavy ones are where sessions end. This is a count of what came next, not proof of what caused it.
What this is, and what it is not
This is a self-study. One operator’s coding agents on one side, and it helps to say so plainly: that half is n of 1, one person and one workflow over seven months. The assistant-fleet half is not one person; it is many different people across several setups and four platforms, which is the only reason the study can say anything about how detection behaves outside a single workflow.
We are not claiming this is how all agents fail everywhere. We are claiming that the standard vocabulary for how agents fail was built without the two things that produce most real failures, a human in the loop and infrastructure that can run out, and that the failures easiest to count are the ones that matter least. Both of those are checkable, and we checked them against our own logs in public.
The instrument’s limits are on the bench, not buried. The precision table that grades our own detectors is published with the same prominence as the findings it qualifies, including the embarrassing rows, because a chart built on a one-in-four detector should look different to you than one built on a perfect one.
Run it on your own logs
Here is where the “at home” part stops being a joke.
Everything above was computed by six plain Python files, standard library only, shipped alongside the bench page. Four commands point it at your own agent logs. Your transcripts never leave your machine: the database that holds your text is structurally separate from the file that holds your numbers, and the only thing built to be shared is an aggregates-only file with no transcript content in it.
This study is one org’s atlas. Medicine solved exactly this problem without pooling patient records: hospitals share results computed by a common method over data that never moves. That aggregates file is the same layer for agent logs. If a handful of people run four commands and share only that file, “how do agents fail?” stops being one org’s record and starts being a map. Share the results. Keep the data.
The labs are not going to do this for you. They already have the data, and reading it back is not their product. It can be yours.
The full atlas, the charts, the precision table, the five catches with their mechanisms, and the four commands are on the bench at cyborg.garden/open-science/experiments/failure-atlas. The number we would most like someone to attack is the 74 to 79 percent with no box. If the standard list covers more of real-world failure than we measured, we want to know.